Author: Lucy Chen
Reviewer: Anthony Pagano
The words from author
if you, your team or your company is having any of the problems below, you should read the document:
- Inaccurate sales planning cause difficult fitting between sales and supply chain.
- Un-smart material requirement plan transformed from sales plan to cause material excess and/or shortage
- Un-Smart production scheduling to cause the supply chain movement can not meet just-in-time movement
- Material pulling-in and arrival time is not completely meet the customer order RDD
- Materials’ converging is a little bit difficult due to different lead time of materials supply.
- Logistics methods and costs are out of control
- Order management and workflow is incompletely connected and manually operated by order trackers in some steps which cause some important points are delayed.
Intelligent Cycle from Sales to Sales
(ICSS)

- I : PLANNING – SALES FORECASTING AND MRP
- II: MATERIAL READINESS AND PULLING IN
- III: MATERIAL RESERVATION
- IV: PRODUCTION SCHEDULLING
- V: LOGISTIC PROCESS
- VI: ORDER EXECUTION WORKFLOW
This document is aimed to streamline and automate the operations across the planning, forecasting, material requirement planning, material pulling-in, production scheduling, Shipping and logistics in fast-moved business areas as well as Integrate and automate it. It adapts newly developed methodologies by the author.
What is engaged in End to End Supply chain?
Supply Chain is not one function, it is a chain which links all the related functions into a line, it includes
- Sales planning,
- Order processing and Order management,
- Material purchasing,
- Production,
- Finish goods warehousing,
- Logistics and delivery!
Actually those are necessary functions across supply chain in many industries.
In Supply chain and E2E management, planning is always the first step and take the leading position in whole chain, but we know that plan is worked out based on customer demand.
In business, we have two class of customers, one is end-consumers(B2C), and another one is enterprise (B2B). Accordingly, there are two kind of supply chains as below:
- End Consumer -Driven Supply Chain (ECDSC)
- Enterprise Demand-Driven Supply Chain (EDDSC)
Whatever ECDSC or EDDSC, the driven of supply chain is always trigged by Sales planning, we name it as SPDSC.
 I : Planning:
Business Planning function is a function which take the lead to work on planning including volumes and values, the plan is worked out by sellers, account managers and their managers, the sources data come from above said Enterprises and End consumers.
Plan for Enterprises customers could directly come from bidding awarding, in spite of products, this needs to build up strong relationship with customers so to increase the win rate and win percentage from bidding. Key Elements below decides what the plan would looks like.
- Bidding frequency – this decides the plan’s time populating.
- Bidding scale per each model – this decides the plan’s volumes
- Bidding pricing and strategies – this decides the win-rate and percentage.
Regarding to what shall be powerful strategies to win more from a bidding, we can separately discuss on it in the section of business strategies.
Plan for end consumers comes from sales team whose customers are end consumers, for automobile industry, part of information should be collected from 4S stores which the products are distributed to, how to work out the sales plan for the requirement from end consumers, that will have a lot of factors to impact it, like sales history, price strategy, product features, competitions, macro-economics, government policy etc. This will be separately talked with intelligent planning in the section of intelligent marketing.
Below, Let’s start from how to structure a planning/forecasting effectively and intelligently so to meet the supply Chain movement with given that your sales team already have first-hand won and/or planned figures. Let’s ask questions below.
What kind of elements and components need to be taken into consideration of sales planning structuring for supply chain movement? It is very crucial and almost decides if the planning can really guide the practice successfully in later steps.
How to mix and combine those elements and components into a methodology.
Combine above 1 and 2, that generates Supply Chain Planning Structure(SCPS). It includes Sales Planning/Forecasting(SPF) and Material Requirement Planning(MRP)
Next, Let’s see how an intelligent supply chain planning structure should be working?!
Regarding to the sales forecasts for supply chain movement, Firstly, we need to classify customer orders into below types.
- Planning Orders – abbr. as “P”
- Official orders. – abbr. as “O”
- Incremental Orders. – abbr. as “I”
Next, let’s describe it in more details.
- Planning orders : The awarded product models/SKU from biddings with specific quantities and targeted fulfillment timeline, or account team forecasted plan for a specific period and different models with a high win-rate. There should be a specific planning number for each planning order, the planning number format can be defined as below and it should be aligned with customers:
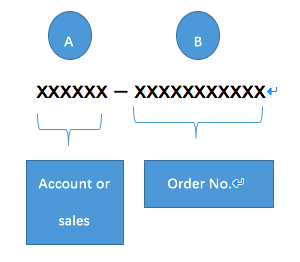
This PO number is combined of part A –account name or and Part B – order no. we can name it as PO batch number, it could be same as award no. for the batch orders earned from enterprise bidding or planning order number from internal sales whose customers are end consumers.
- Official orders : They are orders with specific models/SKU, quantities and Required Delivery Date as well as delivery address, they are the sub-orders under a planning order or incremental demand from customer, if its PO number is under a PO batch number, then it is a sub-order of planning orders, for example :
xxxxxx – xxxxxxxxxxx -xxx
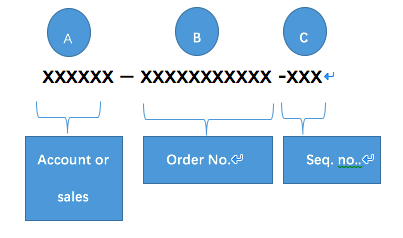
Official PO numbers are combined of part A and B which are same as PO batch numbers plus part C which should be fulfillment sequence number.
With this logic relation between the PO batch no. and official PO number, that will enable system to calculate how many quantities under a planning order for each model/SKU has been fulfilled by proper algorithms, this will be narrated in later phase.
- Incremental Orders: if an official PO number format is same as the format of PO batch number, that means it is an incremental official PO.
- Extended demand: it is out of planning orders, but potential customer demand.
Except the order number format, what else difference for the planning order number and official order no.?
- Planning Orders include models, quantities, fulfillment timeline (specific what is smallest time planning unit)
- Official orders include product models, quantities, Required Delivery Date and delivery address.
We have already identified and defined the elements and components. next let ‘s narrate how to mix and combine those elements reasonably and logically so to ensure sales planning and forecasting is more scientific.
Forecasts Populating Methodology and Algorithms:
- Horizontal Quantity Populating Methods
This method is basically
- Planning orders: Average populating for Planning orders into different period (weekly, half-month or monthly) within fulfillment timeline. and when the official orders come in, the remaining quantities under the planning orders should be subtracted accordingly by algorithms with linked PO numbers to make sure no duplicated counting for quantities.
- Official orders and incremental orders: Populate the quantity in the same planning period of RDD.
Take an example for planning of Dec. 2017
1st Half Dec.=IF(AND([Order type code]=”P”, DATEVALUE(RDD)>DATEVALUE(“10/1/2017”),DATEVALUE(RDD)<(“12/16/2017″)),Quantity/6,IF( AND([OrdertypeCode]=”M”, DATEVALUE(RDD)<DATEVALUE(“12/16/2017”),DATEVALUE(RDD)>DATEVALUE(“11/30/2017″)),Quantity/2,IF(AND(OR([Order type code]=”O”,[Order type code]=”D”),DATEVALUE(RDD)<DATEVALUE(“12/16/2017”),DATEVALUE(RDD)>DATEVALUE(“11/30/2017”)),Quantity,0)))
2nd Half Dec.=IF(AND([Order type code]=”P”,DATEVALUE(RDD)>DATEVALUE(“10/16/2017”),DATEVALUE(RDD)<(“1/1/2018″)),Quantity/6,IF(AND([Order type code]=”M”,DATEVALUE(RDD)<DATEVALUE(“12/31/2017”),DATEVALUE(RDD)>DATEVALUE(“11/30/2017″)),Quantity/2,IF(AND(OR([Order type code]=”O”,[Order type code]=”D”),DATEVALUE(RDD)<DATEVALUE(“1/1/2018”),DATEVALUE(RDD)>DATEVALUE(“12/15/2017”)),Quantity,0)))
- Vertical Consolidation Methods breakdown by win-rate.
Consolidate quantities for the plans that is from different sources (accounts, teams) but with same win-rate.
Take an example as below:
SUMIFS(‘Official POs’!”from”, ‘Official POs’!”to”,’Consolidated Forecasts’!”MODEL”)+SUMIFS(‘Monthly forecast ,’Consolidated Forecasts’!MODEL)+SUMIFS(‘Balanced planning orders’!”quantity”,’Consolidated Forecasts’!model).
For the working file of forecasting methodology, will need to worked out based on specific situation for specific business and integrate into system.
In addition, below components must be considered for planning structure.
Demand for a certain of period : How long period is suitable to define a demand, week? bi-week? or month ? A fast moved industry usually define demand per week, a slow moved industry could define the demand per month, sometimes the time-long for material readiness also impacts the period definition of demands. here, we need to sort out two questions as below:
- What is shortest OTD time which required by customers? or what is average OTD time which required by top 20% customers ranked by required OTD time. (CROTD)
- What is fast frequency that Customer PO has been pulling-in? or what is average PO pull-in frequency for top 20% customers ranked by PO releasing frequency. (MFPOIN)
After we determined the CROTD and MFPOIN, We can work on to set Forecast Refresh Frequency(FRF) : We need to set in system to conduct min(MFPOIN ,CROTD) refresh for monthly demand so to monthly demand can be refreshed more frequently to reflect customer demand in-timely.
Material Requirement Plan
When sales forecasts populating at a required FRF with win-rates are done, then system will move on to next step to transform the populated sales forecasts into material requirement plan. Here some standard and common concepts need to be defined firstly:
- SKU : Stock Keep Unit for finish goods, or smallest product unit.
- BOM : Bill of materials for each SKU.
- Win-rate-MR: What win-rate should be supported to get material ready, for example, >50%.
With using above concepts, then let’s layout how to transform forecasts into material requirement plan.
1). We need to identify what material P/N and how many needed for each model (SKU), and put all of them into material master file.
Algorithms: =SUMIFS(BOM!$”material list”, BOM!SKU list, MRP!model name, BOM!quantity,MRP!material name).
The algorithm will tell:
- What material parts needed for each SKU
- How many pcs for each part.
2) When sales forecast fits Win-rate-MR, it will be transformed into material part no. and populate required pcs into different timeline within the planning period by algorithms for each material part no.., here applies matching concept in maths: 1 matches many and many match 1.
Alogrithms: =’Consolidated Forecasts’!SKU quantity at a month*SUMIFS( MRP”quantities at range of per model” ,’Consolidated Forecasts’!model 1)+’Consolidated Forecasts’!quantity*SUMIFS(quantities at range of per models” )+…+Consolidated Forecasts’!model n)+’Consolidated Forecasts’!quantity*SUMIFS(MRP!quantities ar range of models).
The algorithms will tell:
- How many pcs material part no. are needed at different timeline in a specific planning period.
For the working file of Material requirement plan, different product may be little bit vary, that will need to work out together with a company and then could integrate into system.
 II: Material Readiness and Pulling-In against sales forecasts
When material requirement plan for sales forecast meets a required win-rate is done , next move to Material Pulling-In, here we introduce 4 concepts about material readiness and pulling-in.
- Material Requirement per material part no. Per account: MRPPA (this is actually transformed from sales forecasts)
- Material inventory per P/N per account : MIIPPA
- Materials on the way with ETA per part no. per account: MISPPA
- Material Order Has Been Placed for part no. per account not yet shipped: MOPPPA (material order placing is based on all consolidated requirement for all accounts, but for account level, needs to identify linked PO number and quantity for a part no.)
- Material is reserved by other accounts and will be dropped in production in a designated days (MRFP)
Please note: When work on refresh numbers for above concepts, please ensure you will always base on same cut off time- point!
What volumes of materials need to be pulled in ?= MRPPA -MIIPPA- MISPPA – MOPPPA + MRFP
This practice can completely avoid material excess which has been a big challenge faced by many industries, the big problem is that most ERP system currently just guide team to pull-in materials based on newly generated MRP without taking care of those excess or booked materials, such as what they have on hand, what is on the way, what has been booked/reserved …with a rolling, materials excess is heavy….that is a big money!!!
For upside PO which its demand is not forecasted, need to apply same practice for material readiness and pulling-in
When should pull-in what materials?
To minimize the inventory of material parts, for the material requirement plan for same order with specific RDD, part’s pull-in should be trigged at different time against the different part’s supply lead-time. longer material supply lead time, earlier pull-in, vise versa. we can determine the grades according to different material supply’s lead-time as below:
- Grade I : longest material supply lead time , for example , longer than 3 months
- Grade II: 2nd Long material supply lead time, for example 2-3 months,
- Grade III, 3rd long material supply lead time, for example 1-2 months.
- Grade IV, 4th long material supply lead time, for example, 2-4 weeks
- Grade V, 5th long material supply lead time, for example, 1-2 weeks.
So material pull-in should be trigged from Grade I, then II, III, IV, V…
The principle is to make sure:
- The time long from the date when trig the material pull-in to the required date when materials have to drop to production is longer than the specific material’s supply lead time for a determined buffer time.
- all required materials arrived at a same time that could be one day, or a short period (different industry may set different time-long for material readiness period).

For each grade of materials, it should be engaged with its suppliers for more detailed and aligned engagement supply models and integrate into the ERP solution.
When all required materials are ready, then shift to next step, for example to drop into production line.
 III: Material Reservation and Material Occupying
Material reservation is material part no. flagged with specific sales order number and ready to drop to production. it occurs when customer PO is received and logged with sales orders generated.
Even though, all the materials is default linked to its MRP and sales orders when it is pulled in, that means it is automatically reserved with specific sales orders, but when materials are stored in material warehouses, Material reservation should be screened and double checked by system with following two principles(algorithms) below by looking at at the Open PO Pools.
- PO receive date’s First In First Reserve (FIFR)
- PO RDD’s First Out First Reserve (FOFR)
In steps, it should be firstly reserved by PO receive date in FIFR, and then adjusted by PO RDD in FOFR to ensure Open PO with earlier RDD could be dropped to production earlier and outputted in-timely so to meet RDD delivery perfectly.
Material occupying is to occupy the materials which are booked for other planned orders. then in what cases, Material occupation can be supported?
Material occupation can only be done when there is other planned orders which its RDD for same models and quantities can be postponed or already postponed.
With above pre-condition, in below cases, materials occupations may be supported
- A potential customer PO with 100% confidence level (need approval of SPOC)
- Customer PO has been received and in progress of reviewing prices or some other internal process…it depends on different company’s different practice.
- Logged Urgent sales orders.
 IV: Production Scheduling
All the Sales orders should be set priority levels with taking into consideration of elements below with proper weights
- A: REQUIRED output_date (based on possible shipping methods rather than default shipping methods)
- B: Material Readiness Status
- C: Production lead time
Latest Material drop to production date = A-C , if by the date, there is still material shortage for a specific PO, then the PO’s production priority should be set as urgent with estimated date for dropping to production but without any comparison for meeting required output_DATE.
Priority Level : Priority levels are defined by sponge squeezing theory:
- Normal : if actual date or estimated date when a PO drop to production is earlier than Latest acceptable date Material drop to production, then its priority is normal
- Urgent : if actual date or estimated date when a PO drop to production is later than latest acceptable date which material drop to Production and the later days <= 1/3 of production lead time, then expedition is needed by taking medium level effort
- Top Urgent : if actual date or estimated date when a PO drop to production is later than the latest acceptable date which materials should be dropped in production and the later days >1/3 of production lead time and < 1/2 of production lead time, then production expedition is needed by taking high level effort
- Risk Level: If actual date or estimated date when a PO drop to production is later than the latest acceptable date which material should be dropped to production and the later days > 2/1, then need to take biggest effort to expedite the production.
What efforts could be taken :
- Arrange production line workers to extend the work-time in normal work days with complying governmental labor policy
- Arrange production line workers to work in weekends with complying governmental labor policy
- Add labors and production lines.
V: Logistic Process
Logistics could be adapting engagement model with third party carriers, if your products need mixed shipping methods to expedite the delivery. the below methods are better suitable for your products.
- Shipping methods is set as land-ship as default and approval should be OBTAINED if need SMU and mark in SAP before the date of product output
- After products out-putted, products should be packed based on BOM and packing instruction.
- Warehouse to receive the products from production line .
- Warehouse send the notification to carriers for picking up goods.
- Carrier take away the products and ship with required shipping methods if shipping address is out of the city where the production center located
- Order trackers to double check with carriers and logistics about product shipping status, and confirm no risk to delivery on required delivery date (RDD) .
- Order trackers inform customer for the date which products will be delivered and get ready for the documents which shall be delivered together with products.
- If the required delivery date (RDD) is on the same day when products arrived in destination city, then deliver immediately, if RDD is on later days, products shall be stored in carrier warehouse till the date on RDD to deliver it.
- if RDD is changed per customer or dealer request or per alignment with customer, that should be cycling from step when the change happens .
Shipping methods upgrade process:
- Shipping methods are set as normal “Land-ship” in ERP as default shipping method, and
- Required output_date has to be set based on the default shipping methods (normal land-ship in this case)
- if any reasons caused the estimated ouput_date is later then the require date identified in point 2, a risk will be pop up from the list of customer PO POs.
- Once the risk is pop up for a specific PO/Sales order, order trackers please work with product center SPOC to know the possibilities of risk removal if shipping method will not be upgraded.
- If possibilities of risk removal to meet Required output-date is low in the condition of the no upgrade of shipping method, then application for airship should be raised by order trackers with telling a due date for final approval
- Approvers should make sure the approvals be released by due_date.
- After Airship approval is obtained, Logistics should be immediately informed to book air flight.

VI: Order Execution Work-Flow
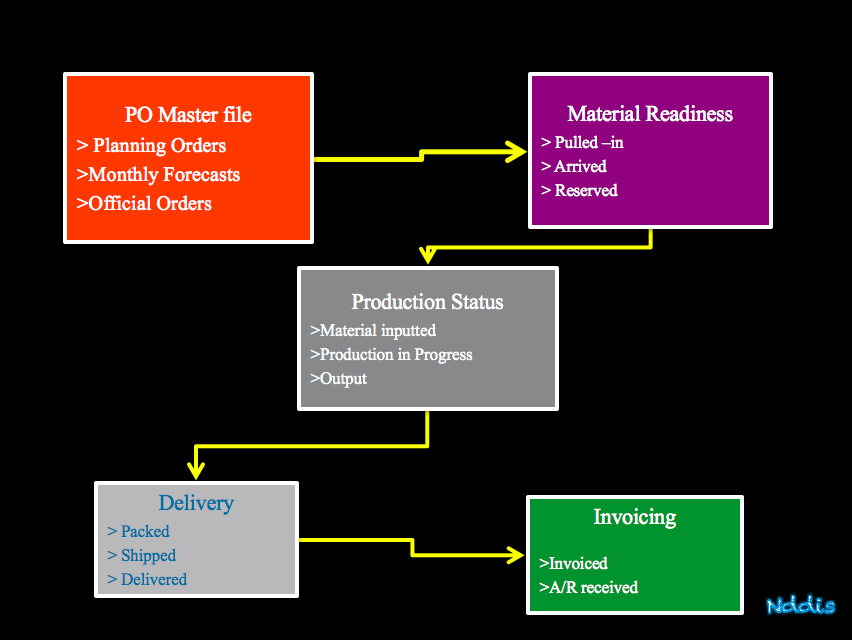
Order Execution Workflow is a workflow along with order movement and its status changes , the workflow is a daily routine job which occupied 90% of workload in supply chain, so a E2E shared platform(E2ESP) will significantly reduce the workload of offline manual tracking and reporting and ensured all the data ‘s consistent and bring everyone into the same page, and automated work flow has been ensuring that no any work or steps in order execution will be missing. The major order status are as below:
- PO received
- SO Logged
- Production is Schedulled
- Production is Progress
- Products are outputted
- Products are in Shipping
- Products are delivered
- The taskss assigned from a status to next steps are as below :
- PO received -> SO logged :
Tasks: In the step, the customer PO will be feed into a E2E shared platform, a sales order no. will be generated by ERP. the order status is automatically changed to be “Sales order logged”.
- SO Logged -> Production Scheduled
Tasks: In this step, the SO with SO# generated in ERP , system will calculate a date for material drop to production according to RDD and production lead time. and status will be changed to be “Production scheduled” by system.
- Production Scheduled -> Production in Progress
Tasks : In this step, the date of drop to production is on the “today”, system will change the status to be “Production in progress” and system will put the date in the relevant orders and estimated output_date is come out too, system will also check the estimated output_date against the required output_date with given default shipping method, a risk alert will pop up if any risks and remind production scheduler to optimize the schedule and expedite the production and may upgrade shipping methods…
- Production In Progress – >Out-putted
Tasks: In this step, the confirmed output_date has been replaced by estimated output date in system, system checks against the required output_date and take action to flag reasonable shipping methods for the PO (if risks remaining and system will automatically upgrade the shipping methods if needed), status is re-flagged as ‘Products are out-putted”.
- Out-putted ->Shipped
Tasks: In this step, the products are outputted from production line and ready to ship, if the products will be delivered to a city same as the production center located , then system will be hold shipping flag in ERP until the date of RDD, if the products will be delivered to other cities, the products shall be shipped right away based on updated shipping methods in ERP, system will flag the order status as “Shipped”. there will be system interface with 3rd party logistics service.
- Shipped -> Delivered
Tasks: In this step, Products are ready to delivery, customer will be informed by system to get ready to receive the products , and an electronic delivery note shall be sent by system to customers by ERP for signatures, status is flagged as “Delivered”.
Author: Lucy Chen
- Version 1.0 – 2018.5.8
- Version 2.0 – 2018, 6, 10
About author: Lucy Chen, former HPE Global Supply Chain Hyper-scale E2E management, Business planning director, HPE ES Global APJ/China Business Strategy and Operation director.
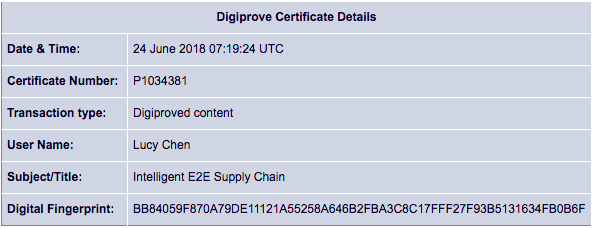
| This document modified from author’s original document intelligent E2E supply chain and it is digiproved original contents with details as below, You may read the original content in the context in which it is published at this website. No other copying or use is permitted without written agreement from the author, you can contact the author by leaving a message to this post. We will forward your message to the author! or you can send email to service@nddis.com.cn for consulting about or requesting service on data science. thank you! |
| Original content here is published under these license terms: | X |
|
| License Type: | Read Only | |
|
| License Summary: | You may read the original content in the context in which it is published (at this web address). No other copying or use is permitted without written agreement from the author. |





 I : Planning:

 II: Material Readiness and Pulling-In against sales forecasts
 III: Material Reservation and Material Occupying
 IV: Production Scheduling

